

Main Objetive
Identify players capable of delivering a significant short-term impact — particularly in the final third — using data-driven modeling of expected contribution versus market cost and fit. This allows clubs to optimize strategic signings for immediate uplift, especially in crucial moments of a season.
The Problem
The Old Way
SIGN PLAYERS BASED ON GENERAL PERFORMANCE
ONE-SIZE-FITS-ALL RECRUITMENT
NO REAL CONCEPT OF “IMPACT PROFILE”
IGNORE MATCH FLOW DYNAMICS
IGNORE POST-5-SUBSTITUTION DYNAMICS
The New Way
SIGN PLAYERS FOR SPECIFIC PHASES OF THE MATCH
FIT-BASED SCOUTING BY TACTICAL ROLE AND GAME MOMENT
TARGET IMPACT PLAYERS DESIGNED FOR TRANSITIONS & BURSTS
ADAPT TO TEMPO, SPACE, AND GAME EVOLUTION
BUILD SQUADS AROUND MODULAR ROLES & BENCH IMPACT
Technical Description
Contribution Component (CC)
Measures direct offensive impact: CC(p) = west · (xG(t)/(90m+1))
Where:
CC(p) = Contextual Contribution
IC(p) = Impacted Chemistry


Influence Component (IC)
Assesses creation value: IC(p) = xC(p) · (90m+1)
Weighting Mechanism
SCI(p) = α · CC(p) + (1-α) · IC(p)
α balances immediate impact vs. cumulative influence.

Contextual Weight (west)
Captures game state differential when the player enters the match
.png)
Details:
-
Gray line: Tracks the match score margin (team perspective) throughout the game — showing when the team was losing or catching up.
-
Blue vertical line (min 50'): Moment when Player A is subbed in.
-
Red vertical line (min 70'): Moment when Player B is subbed in.
-
Blue line: Player A's estimated impact on team performance (progressive increase).
-
Red line: Player B’s estimated impact, with a steeper late effect but starting later.
Player A contributed consistently across 40 minutes, initiating the comeback from a worse score state.
Player B had a strong but shorter impact, benefiting from a better game situation.
The chart emphasizes that entry timing and match context are crucial in evaluating true player impact, not just the final score.
.png)
-
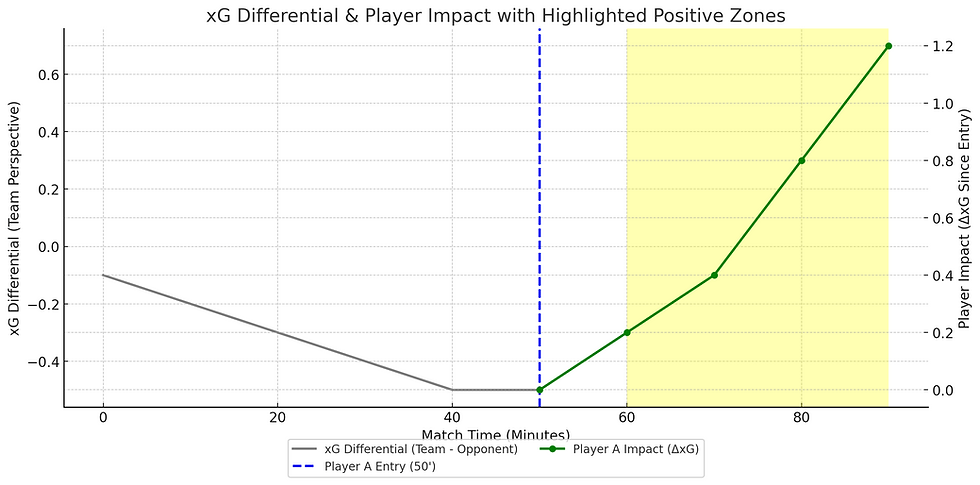
Gray line: Shows the evolution of the xG differential (team – opponent) over time. Before the 50th minute, the team is underperforming offensively (declining trend).
-
Blue vertical line (min 50'): Marks the exact moment Player A is subbed in.
-
Green line: Represents the cumulative offensive impact of Player A after entering the pitch, measured by the increase in xG since entry. It clearly shows a positive and sustained effect.
-
Yellow shaded area: Highlights the post-entry phase where the player significantly improves the team’s offensive performance (∆xG > 0).
Player A exhibits a high SCI (Contribution Index): after coming on, he reverses the team’s negative momentum and creates a positive xG differential.
This graph is ideal for identifying players with immediate offensive impact, especially valuable for rotation signings or tactical substitutes.
Impact is not volume — it’s velocity. WINNING scouts players who change games, not just play them."
Our model detects explosive talent that fits your final third — fast, efficient, and tailored to your tactical DNA.
Other Objetives
Quantify Immediate Offensive Contribution
Detect players with above-average influence on expected goals and assists per minute.
Accurate
Contextual
Find Market Inefficiencies
Surface undervalued talent relative to output, especially in non-top-5 leagues.
Strategic
Analytical
Evaluate Positional Fit & Role Impact
Score players based on their fit with the target team’s tactical structure and needs in the final third.
Role-based
Tactical
Accelerate Decision-Making
Provide ranked shortlists of high-impact players by urgency and availability.
Efficient
Responsive
Enhance Scouting Accuracy
Reduce signing risk by comparing players to high-impact historical references.
Comparative
Risk-aware